How to Manually Geolocate a Photo: Reading Visual Clues Like an Expert

You're looking at a photo. No caption, no metadata, no context. Just an image — a street corner, a building, a landscape. Could you figure out where it was taken?
A trained geolocation analyst can. Not every time, and not with perfect accuracy, but often enough to be useful. The skill isn't supernatural — it's systematic observation combined with geographic knowledge and cross-referencing. And while AI tools like GeoSpy can produce a location prediction in seconds, understanding the manual process makes you a better investigator, a more critical consumer of AI results, and a more privacy-aware photographer.
This guide teaches you the systematic approach that professional geolocators use to read visual clues in photographs. Whether you're an OSINT practitioner, a journalist verifying a source image, or simply curious about how image location detection works, these techniques will change the way you look at photos.
If you're new to the concept of AI-powered geolocation, you might want to start with our technical deep dive on how AI photo geolocation works — it covers the underlying technology that automates many of the techniques described below.
The Mental Model: Geographic Fingerprinting
Every photograph contains a geographic fingerprint — a unique combination of visual signals that, taken together, constrain the possible locations where the photo could have been taken. No single signal is definitive. A palm tree grows in dozens of countries. Red brick buildings exist on every continent. But when you combine the palm tree with the specific style of streetlight, the language on a distant sign, the color of the soil, and the angle of the sunlight, the possibilities narrow dramatically.
The process works like a funnel:
- Broad signals narrow the search from "anywhere on Earth" to a region or continent (climate, vegetation, sunlight angle)
- Regional signals narrow from continent to country (language, architecture, infrastructure standards)
- Local signals narrow from country to city or neighborhood (specific landmarks, street configurations, local signage)
- Precise signals narrow from city to exact location (recognizable buildings, unique features, street view matching)
At each stage, you're eliminating possibilities rather than confirming them. This is a critical mindset: don't ask "where is this?" Ask "where could this NOT be?"
Signal Category 1: Architecture and Building Style
Buildings are the most information-rich elements in most photographs. The way people build varies enormously by climate, culture, history, and economic development — and these variations create patterns that are readable from a single photo.
Roof Design
Roofs are climate indicators. Their shape, pitch, and material tell you about the local weather patterns, which tells you about the latitude and geography.
- Flat roofs: Mediterranean, Middle Eastern, North African, and arid climates where snow load isn't a concern. Also common in modern commercial architecture worldwide.
- Steeply pitched roofs: Northern Europe, mountainous regions, areas with heavy snowfall. The steeper the pitch, the more likely heavy snow is a regular occurrence.
- Curved tiled roofs: East Asian (particularly Korean hanok and Japanese traditional architecture), but also Mediterranean (Italian, Spanish).
- Thatched roofs: Rural areas in the UK, Ireland, parts of Africa, and Southeast Asia. Rare but highly location-specific when present.
- Corrugated metal roofs: Common in developing regions across Latin America, Africa, and South Asia. Not location-specific on its own, but combined with other signals, helps narrow the region.
Construction Materials
The materials used in construction are determined by local geology, climate, and building traditions.
- Adobe/rammed earth: American Southwest, North Africa, parts of South America. Distinctive earthen color and texture.
- Red brick: Common in the UK, Northeastern US, Netherlands, and parts of Germany. The specific shade of red varies by region — London stock bricks are yellowish-brown, while Boston bricks are darker red.
- Stucco/plaster: Southern Europe, Latin America, Mediterranean. Usually white or pastel-colored.
- Concrete block: Universal in modern construction, but the finish varies. Smooth painted concrete in Latin America versus rough exposed concrete in brutalist Eastern European architecture.
- Wood construction: Common in North America (suburban houses), Scandinavia, Japan. The style of wood construction differs — American clapboard siding looks different from Japanese cedar paneling.
Building Configuration
How buildings are arranged relative to each other and to the street is a powerful signal.
- Setback distance: American and Australian suburban houses typically have large front yards (setbacks of 5–15 meters). European urban buildings often sit directly on the sidewalk. Japanese urban houses have minimal setbacks.
- Building density: Closely packed attached buildings (terraced houses) are common in the UK, Netherlands, and parts of Latin America. Detached houses with gaps between them are more common in North America and Australia.
- Uniformity vs. variety: Soviet-era housing blocks are instantly recognizable by their uniform concrete panel construction. American suburban developments have similar uniformity but with different architectural styles. European old towns have high variety in building styles within a single street.
Signal Category 2: Language and Text
Any visible text in a photo is a geographic goldmine. Language, script, signage design, and even font choices can narrow a location to a specific country or region.
Script Identification
The writing system visible on signs, storefronts, or vehicles immediately eliminates most of the world:
- Latin script: Most of Europe, the Americas, sub-Saharan Africa, Southeast Asia (Vietnam, Indonesia, Philippines, Malaysia)
- Cyrillic script: Russia, Ukraine, Belarus, Bulgaria, Serbia, North Macedonia, Mongolia, parts of Central Asia
- Arabic script: Middle East, North Africa, Iran, Afghanistan, Pakistan (alongside other scripts)
- Chinese characters: China, Taiwan, Singapore (alongside other scripts)
- Japanese (three scripts): Japan — the combination of kanji, hiragana, and katakana is uniquely Japanese
- Korean (Hangul): South Korea, North Korea
- Devanagari: India, Nepal
- Thai script: Thailand
- Greek script: Greece, Cyprus
Language Within a Script
Once you've identified the script, the specific language narrows it further. Spanish, Portuguese, Italian, and French all use Latin script but are orthographically distinct. A sign reading "Farmacia" is Spanish or Italian. "Pharmacie" is French. "Farmácia" is Portuguese. "Apotheke" is German.
Sign Design and Standards
Road signs follow national design standards, making them highly identifiable:
- Warning sign shape: Yellow diamonds (US, Australia, New Zealand, Japan) versus white triangles with red borders (Europe)
- Speed limit sign design: White circle with red border and black number (Europe) versus white rectangle with black text (US) versus yellow circle with red border (China)
- Street name sign placement: Mounted on poles at intersections (US) versus mounted on building corners (Europe) versus overhead signs (some Asian countries)
- Traffic light configuration: Vertical mounting with red on top (most of the world) versus horizontal mounting (US, Japan, some others). The presence of a red-amber phase before green is specific to the UK and Germany.
License Plates
License plates are country-specific and often region-specific within countries. Even a partial view of a plate can identify the country:
- European plates: White background with a blue strip on the left containing the EU flag and country code (e.g., "F" for France, "D" for Germany)
- US plates: Vary by state, with distinctive colors and designs. Even a glimpse of the plate color and format can identify the state.
- Japanese plates: White or yellow background with specific number/character format
- Chinese plates: Blue background with white characters (standard plates)
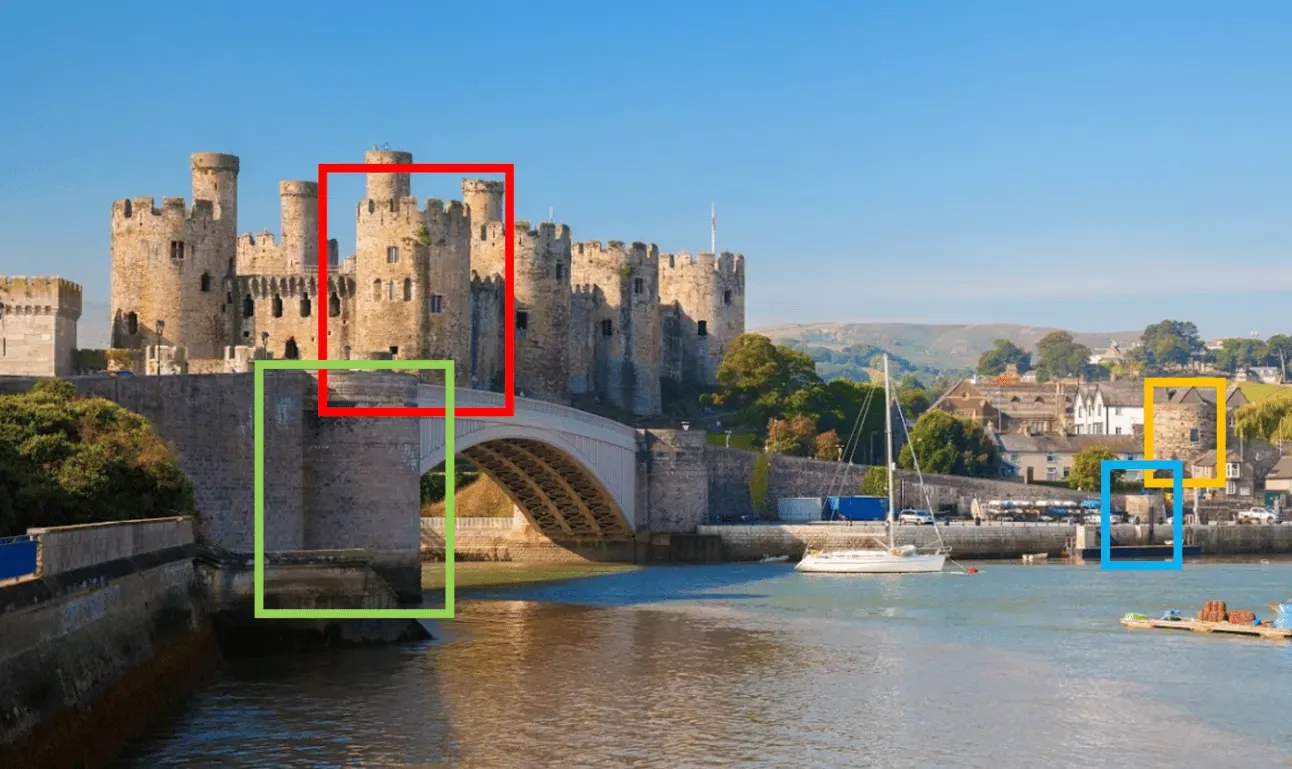
Signal Category 3: Vegetation and Natural Environment
The natural world visible in a photo — trees, plants, soil, terrain — provides climate zone signals that work at a continental scale.
Tree Species as Climate Indicators
- Palm trees (coconut): Tropical coastal areas — Caribbean, Southeast Asia, Pacific islands, parts of Africa
- Palm trees (date): Arid regions — North Africa, Middle East, parts of California and Arizona
- Olive trees: Mediterranean climate — Spain, Italy, Greece, Turkey, California, parts of Australia
- Birch trees: Northern temperate — Scandinavia, Russia, Canada, northern US
- Eucalyptus trees: Australia (native), but widely planted in California, Portugal, and parts of Africa
- Bamboo: East and Southeast Asia
- Baobab trees: Sub-Saharan Africa, parts of Madagascar and Australia
- Cactus (saguaro): Sonoran Desert — specifically Arizona and Sonora, Mexico
Terrain Types
- Desert: Sahara, Arabian, Gobi, Atacama, Mojave, Sonoran — each has distinctive coloration and vegetation
- Tropical rainforest: Amazon, Congo, Southeast Asian jungles — dense green canopy, high humidity (visible in atmospheric haze)
- Alpine: Mountainous terrain above the tree line — Rockies, Alps, Andes, Himalayas
- Coastal: Beaches, cliffs, shorelines — sand color varies by region (white sand in the Caribbean, black sand in Iceland and Hawaii, red sand in parts of Australia)
- Grassland/savanna: African savanna, American prairie, South American pampas, Eurasian steppe
Soil Color
Soil color is determined by mineral content and weathering, which varies by geology:
- Red laterite soil: Tropical regions with high rainfall — parts of India, Southeast Asia, Africa, Brazil
- White chalk: Southern England, parts of France
- Black volcanic soil: Iceland, Hawaii, parts of Italy, Japan
- Yellow-brown loess: Parts of China, Central Europe, Midwestern US
Signal Category 4: Infrastructure and Street Design
The built environment — roads, utilities, public infrastructure — follows national standards that are highly identifiable.
Road Markings
- Center line color: Yellow center lines (US, Canada, Australia, New Zealand) versus white center lines (most of Europe)
- Lane line style: Solid versus dashed, and the specific pattern of dashes, varies by country
- Crosswalk design: Zebra crossings (white stripes) are common in Europe and the UK. Ladder-style crossings are common in the US. Continental crossings (wide stripes) are used in some countries.
Utility Infrastructure
- Power line configuration: Overhead power lines on wooden poles (common in North America, rural Australia) versus underground cables (common in Western Europe) versus overhead on concrete poles (common in developing regions)
- Utility pole material: Wood (US, Canada, rural areas worldwide), concrete (many European and Asian countries), metal (Japan, some Scandinavian countries)
- Transformer placement: Pole-mounted (US, many developing countries) versus ground-mounted in substations (Europe)
Street Furniture
- Trash can design: Varies enormously by city — Parisian green wire baskets, London's round bins, Tokyo's transparent bins (for security)
- Bench design: Specific designs are often associated with particular cities or park systems
- Bus stop design: Shelter style, signage, and even the font used for route numbers can be city-specific
- Mailbox/Post box: Royal Mail red post boxes (UK), blue USPS collection boxes (US), yellow mailboxes (France, Germany, Sweden)
Signal Category 5: Shadows and Sun Position
If you know the date a photo was taken, shadows can reveal the latitude. The sun's angle above the horizon at a given time depends on the latitude, date, and time of day. By measuring shadow length relative to the object casting the shadow, you can calculate the sun's elevation angle, which constrains the latitude.
How It Works
- Identify a vertical object and its shadow in the photo — a pole, a building edge, a person standing
- Estimate the ratio of shadow length to object height (this gives the tangent of the sun's elevation angle)
- Determine the time of day from the direction and length of the shadow (morning shadows point west, afternoon shadows point east)
- Use a sun calculator like SunCalc or the NOAA Solar Calculator to find which latitudes have the sun at that elevation angle at that time on that date
This technique, called chronolocation, is especially valuable for images from conflict zones where the date is known from news reports. It's also one of the techniques that AI geolocation systems use internally — for a technical explanation, see our AI geolocation deep dive.
When to Use AI vs. Manual Techniques
AI geolocation and manual geolocation are complementary. Here's how to combine them effectively:
Start with AI
Upload the photo to GeoSpy for an instant first-pass prediction. This gives you a starting hypothesis — a region or city to focus your manual analysis on. The AI processes the same visual signals described above, but in seconds rather than minutes. Try it yourself — it's free and requires no signup.
Verify with Manual Analysis
Don't trust the AI prediction blindly. Use the manual techniques in this guide to verify each signal independently. If your manual analysis confirms the AI's prediction, your confidence increases. If it contradicts the AI, investigate further — the AI may be wrong, or you may have missed something.
Use Manual Techniques When AI Fails
AI geolocation tools struggle with:
- Rural or natural landscapes with few human-made features
- Indoor photos
- Photos with minimal distinctive features
- Photos from regions underrepresented in training data
In these cases, manual signal extraction — particularly terrain analysis, vegetation identification, and shadow chronolocation — may succeed where AI fails.
Use AI for Scale
If you need to geolocate dozens or hundreds of photos, manual analysis isn't feasible. AI tools can process images at scale, giving you initial hypotheses for each one. You can then prioritize which images warrant deeper manual investigation. See our comparison of AI geolocation tools for options.
How long does it take to manually geolocate a photo?
Can anyone learn to geolocate photos, or does it require special training?
Is manual geolocation more accurate than AI?
How can I make my own photos easier to geolocate?
Start Geolocating
The fastest way to practice is to start with an AI assessment and then verify it manually. Upload a photo to GeoSpy, note the AI's prediction, and then work through the signal categories above to see if you can confirm or challenge it. You'll be surprised by how much geographic information is hiding in plain sight — in every building, every sign, every tree, and every shadow.